Reporting
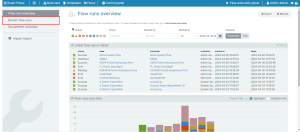
Smart Flows comes with a Reporting dashboard that provides an overview of the flow's detailed statistics. Reporting helps administrators view the overall statistics of flow runs and provides an easy way to see what's going on. For instance, here's a chart that shows the number of flow runs per day for the last month, with red representing flows that failed.
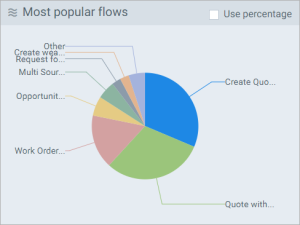
You can use this information to analyze which flows are the most popular and which are causing problems. You can also use tags and filters to quickly find specific information that you're looking for.
Statistics
The reporting shows the following statistics:
- Latest flow runs in detail
- Flow runs over time
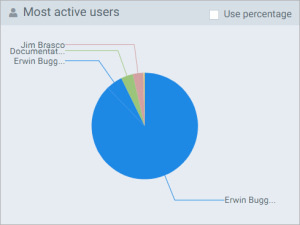
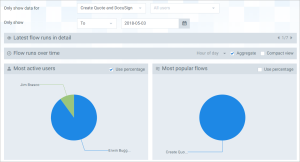
- Most active users
- Most popular flows
All these statistics are within tabs that can be folded by clicking the title.
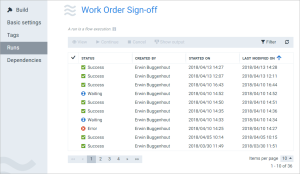
The Latest flow runs in detail displays every flow run in your project.
You'll see only 10 in List view, but you can go to the next page using the page control in the upper-right corner.
You can select on the flow's name to go to that flow's detail view.
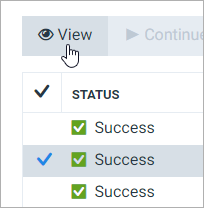
You can select a flow and then select View to see more detail.
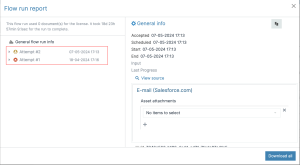
The left-hand navigation of the Flow run report shows the number of attempts an execution takes. The Download button in the lower-right corner downloads a JSON file containing all the information about the flow run - invaluable information for the support team to troubleshoot and determine the root cause.
The Flow run report dialog shows all the previous iterations as well as the current run.
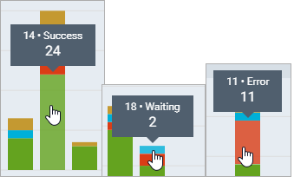
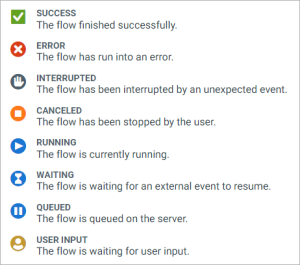
The flow runs over time tab displays a bar chart of the flow runs over time. The flow runs are color-coded according to the status of the flow run.
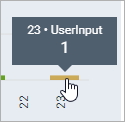
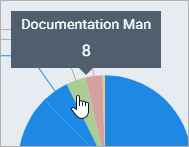
You can hover over a bar to see the number of runs and the status.
You can use the filtering options to get the view described in the table below.
Filters
You can filter all the data shown on the Reporting page by using the filter controls at the top.
You can filter data in three ways, or any combination of them:
-
Only show flow runs of a certain status
-
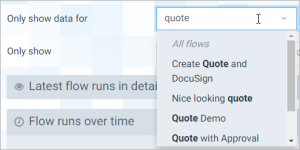
Only show data for a certain flow/user
-
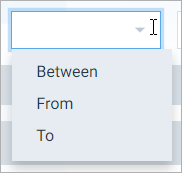
Only include flow runs from a certain period
Procedures
You can export all the flow executions run within the project into one file (*.csv). This is ideal in scenarios where users would like to distribute data to relevant stakeholders to manage data efficiently.
| 1. | On the Reporting dashboard, select Export. |
| 2. | Select the All tab. |
| 3. | Specify a file name for the export. |
| 4. | (Optional) Select Include flow execution state to include the flow execution state for the export. |
Selecting the Include flow execution state Option increases the file size exponentially. Unless you need detailed information about the state of an execution, we recommend to not checking the checkbox.
| 5. | Select Export. |
All the flow run data gets exported.
You can restart Smart Flows Flow Executions in any of the following statuses:
-
Error
-
Canceled
-
Warning
-
Interrupted
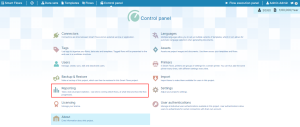
| 1. | Select the Control Panel button. |
The Control Panel page displays.
| 2. | From the Control Panel select Reporting. |
| 3. | From the left-hand navigation, select Recent flow runs. |
| 4. | In the Recent flow runs page, select a flow run with one of the given statuses mentioned above. |
You can restart up to 100 flows at a time.
| 5. | Select Restart. |
Notice that the Status changes to Queued.


